
1
2
3
4
5
6
7
8
9
10
11
12
13
14
15
16
17
18
19
20
21
22
23
24
25
26
27
28
29
30

1
Enter the first day of the period, here.
2
Enter the last day of the period, here.
3
Select the Emission Calculation Model that you want to use for this report.
4
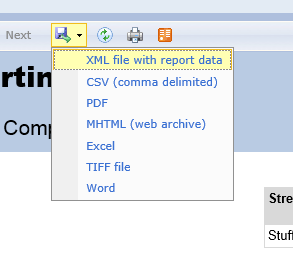
Select this icon to open this drop down. We have designed this entire process to work very well with Excel!
5
This will show the Factor Type that was selected. Either Refinery, SOCMI, etc. This determination is based on the Model, Component Type, Physical State and whether or not you have an Alternate Factor set for a chemical associated with any component.
6
Shows the most advantageous credit that was applied- if there were more than one. Examples of credits are: exemptions, certain Comp Types or Sub Types, welded, CVS, etc. The Best (percentage) Credit that is used is shown in the Interval Grid.
7
Total percentage of the stream that is BOTH reportable and organic.
8
Total percentage of the stream that is organic (may or may not be reportable).
9
The number of chemicals in this stream that have an Alternate Factor Set assigned to them.
10
Reference for each interval in this period for this component.
11
Either the first day of the period OR the day of a PPM that is being used for this period OR the day that a profile change occurs that may or may not impact the Ems Calculation.
12
The Profile Code that could impact the Ems Calculation. You always see the first day of the period on which the component was Active. You will also see events such as TUP, TUiS, Deactivate or ReActivated.
13
Why the PPM that is shown was originally collected. Different M21Whys have different effects on Ems Calc.
14
The total PPM before the background is subtracted. Calculations are based on Net PPM, if your program is adjusting for background.
15
The calculated Response Factor for the STREAM based on the response factor and concentration of each chemical. The vast majority will be 1.
16
The Net PPM times the Response Factor if the Response Factor is greater than 3.
17
The Hourly Emission Rate that is based on a certain Reference Point. It could be the PPM that was taken in the period the base emission rate for this component or the rate derived from an earlier Interval. For Tag 1, is the Average Emission Factor rate for an unmonitored Valve in Light Liquid Service.
18
Many intervals have an Initial and a Final Hourly Emission Rate. These two numbers are typically based on PPM readings. In the case of an unmonitored component, we just have one. The Reference is also the Final.
19
interval Hourly Emission Rate. This is either the Reference HER or the AVERAGE of the Initial HER and the Final HER.
20
Hour in the interval. Each Interval is measured by the number of hours it contains.
Total hours in the month. (There were 366 days in 2016.)
21
interval Gross Emissions: the hourly emission rate during this interval (iHER) times the hours in this interval (Hi). In this case it is 0.010900 times 8783.0 = 95.73747 kg.
22
If there are non-reportable chemicals (such as methane or ethane) then a reportability adjustment may be made. If so, that % is shown in this spot.
All chemicals are reportable in this stream so the Adjustment is 100% (or no adjustment).
23
interval Gross Reportable Emissions. iGE times the Reportability Adjustment.
Total of all intervals: Gross Reportable Emissions for the Period
24
Percentage credit (discount) that is available. If more than one Credit is available, you will only see the highest percentage shown here.
Total of all intervals: Net Reportable Emissions for the Period
25
interval Net Reportable Emissions. iGRE reduced by any available Credit- shown in Kilograms.
26
iNRE show in pounds.
27
Speciated Net Reportable Emissions
28
Emissions are estimated for Inorganic and Inert compounds based on simple per centage calculation and may or may not be useful.
29
The Alternative Emissions Factor for a Refinery LL Valve.
30
Total of all intervals: Gross Emissions for the Period
Quality & Information Security