Note: This article will outline the options available to LDAR (Leak Detection and Repair) programs regarding pegged emission rates and analyzers, focusing on valves in light liquid/gas vapor service. The information is prepared solely for your consideration. LDARtools does not provide regulatory advice or guidance.

Originally published by Fugitive Emissions Journal 10/02/2024.

Definitions and Background

Pegged Emission Rate – The specified emission rate used for any leak with a “pegged” screening value (i.e., any PPM reading exceeding the Analyzer Peg Value).


Analyzer Peg Value – The highest PPM reading an analyzer is designed to detect.


When a PPM reading is higher than the Analyzer Peg – “The instrument measurement may exceed the scale of the instrument, referred to as a ‘pegged’ readout. For several instruments, the highest readout on the scale is 10,000 ppmv. For generating an emissions estimate, a dilution probe should be employed to measure concentrations greater than the instrument’s normal range unless average emission factors for greater than or equal to the ‘pegged’ readout are applied. Extending the measurement range necessitates calibrating the instrument to the higher concentrations.” (From section 2.3.3 of the 1995 Protocol for Equipment Leak Emission Estimates).


Calculation of Emissions Using Correlation Equation

To estimate emissions using the EPA Correlation Approach, measured concentrations (screening values in PPM) for each component are individually calculated by applying the PPM reading to a specific Correlation Equation, specified for that component type and physical state.


How it works: There are three possible scenarios in calculating emission for a specific component.

  1. If there is no actual inspection available (represented in PPM), then you must use the Average Emission Factors provided by the EPA for the component type and physical state.
  2. If there is an inspection available (represented in PPM), and the PPM reading is lower than the Analyzer Peg Value, you must use the specific Correlation Equation provided by the EPA for that component type and physical state.
  3. If there is an inspection available (represented in PPM) and the PPM reading is equal to or greater than the Analyzer Peg Value, then you must use the Pegged Emission Rate for that component type and physical state. This Pegged Emission Rate inevitably results in a significantly higher emission rate than would the Correlation Equation calculation (#2, above).

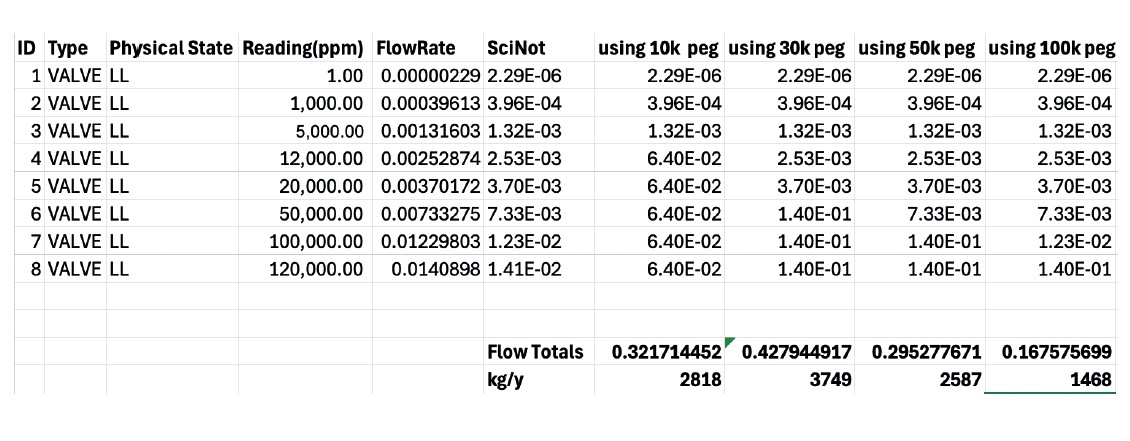
For an analyzer with an Analyzer Peg Value of 10,000 PPM, any reading above 10,000 ppm can be easily calculated using the 10k PPM Pegged Emission Rate. Similarly, for an analyzer that pegs at 100k, use the 100k Pegged Emission Rate (potentially subject to the calibration requirements below).

Considerations for Different Analyzer Peg Values

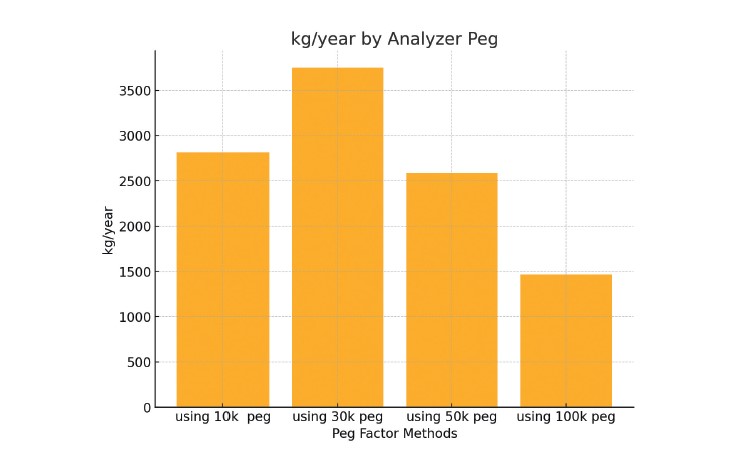
If you have an analyzer with an Analyzer Peg Value of 30k or 50k, it would be prudent to use the correlation equation up until that pegged value, and then use the 100k pegged value above it. However, this approach may result in an increase in reported emissions.

Example: Using an analyzer with a 30k pegged emission rate:

  • PPM value is 30,001 (a pegged reading).
  • 100k emissions factor converted back to ppm is 2.6 million ppm.
  • If using a 10k ppm analyzer peg, emissions reported would be about 912,000 ppm.

Converting mass back to ppm is not considered best practice, but is used here for illustration purposes.

Increased accuracy of reporting for components leaking between 10k and the analyzer peg value is a benefit of using a 30k or 50k analyzer peg, but pegged values could significantly increase reported emissions.


Questions

Do you need to calibrate to the Analyzer Pegged Value?

Maybe. The 1995 Protocol states: “The instrument measurement may exceed the scale of the instrument, referred to as a ‘pegged’ readout. A dilution probe should be employed for concentrations beyond the instrument’s normal range unless average emission factors for greater than or equal to the ‘pegged’ readout are applied. Extending the measurement range necessitates calibrating the instrument to higher concentrations.”

Since “higher concentrations” are not defined, one interpretation is to use the highest available concentration for calibration, which for methane is ~25k ppm in air (above which it becomes explosive).

Another option is to have a factory calibration done annually at 100,000 ppm. This calibration would persist during routine daily calibration.


What is my Analyzer Peg Value?

The 1995 protocol was developed with analog analyzers that could not exceed the meter dial’s printing. Modern analyzers use dynamic ranging to extend the upper limit significantly, but accuracy and linearity above 10,000 ppm (except for phx42) are uncertain, especially without higher value calibration.

The 2011 & 2015 protocols state: “If the monitoring instrument measures concentrations only up to 10,000 ppmv or 100,000 ppmv, the applicable values for pegged emission rates in Table 2-2 (below) are used to estimate emissions.”


Factors Determining Max Reliable PPM

  1. Hardware on the Circuit Board: This chip reads minimal current from the detector. Better accuracy at low ppms generally means a lower max reading before saturation. Analyzers impacted: All.
  2. Software Controlled Max PPM Value: Possible for phx42 but not implemented.
  3. Lack of O2 to Maintain Flame: For sample pumps providing combustion air (assuming methane), the limit is ~50k ppm. Linearity is impacted below this, and calibration to a higher value like 25k ppm can somewhat correct for this for values below the calibration point. Analyzers impacted: phx21, TVA1000b, and TVA2020.
  4. Detector Temperature Max: Prevents Teflon inside the detector from overheating; this only applies to phx42. The limit will not initiate shutdown until well over 100k ppm for some time.


Specifications from Common Manufacturers (as of 07/29/24)

TVA1000b:

  • Dynamic Range: 5-2,000 ppm (PID) isobutylene; 0.5-50,000 ppm (FID) methane
  • Linear Range: 5-500 ppm (PID) isobutylene; 0.5-10,000 ppm (FID) methane

TVA2020:

  • FID Instrument: ±10% of reading or ±1.0 ppm, from 1.0 to 10,000 ppm
  • Dynamic Range: 5-2,000 ppm (PID) isobutylene; 0.5-50,000 ppm (FID) methane
  • PID Instrument: ±20% of reading or ±0.5 ppm, from 0.5 to 500 ppm
  • Concentration: FID: 0-30,000 ppm (methane); PID: 0-2,000 ppm (isobutylene)

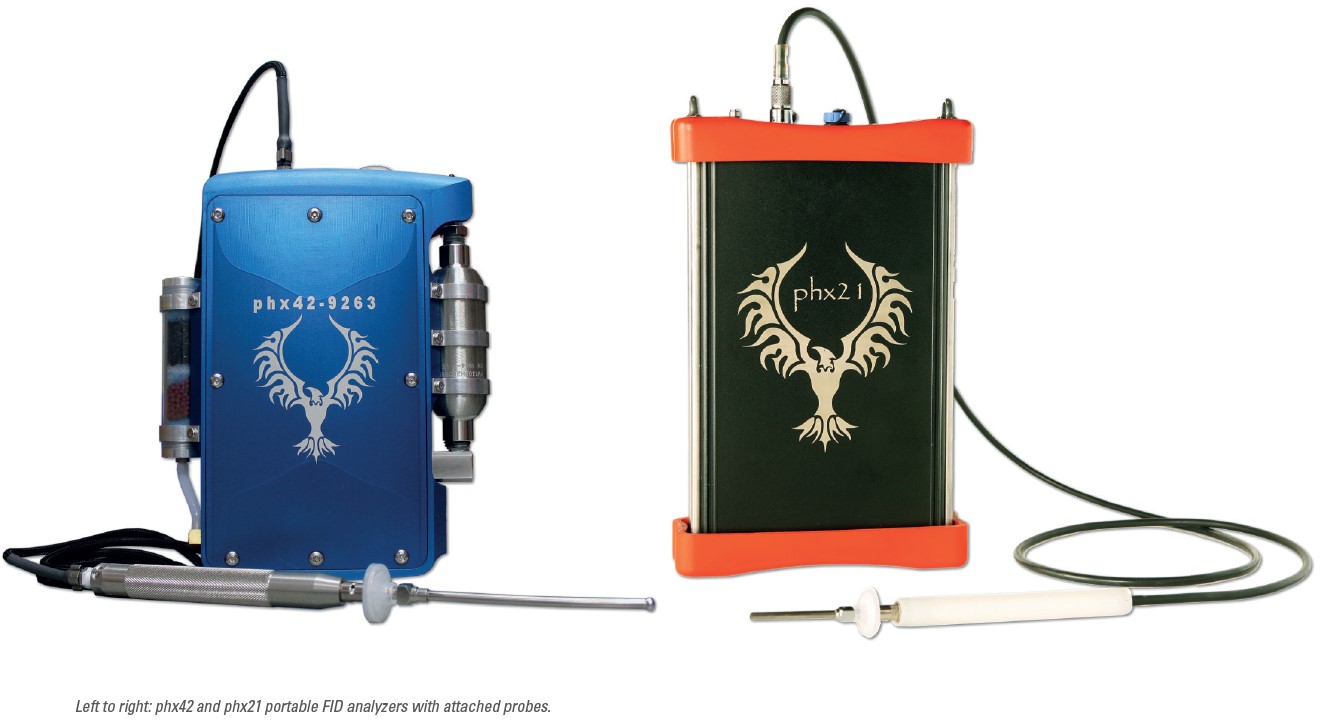
PHX21:

  • Range: 0-50,000 ppm Methane

phx42:

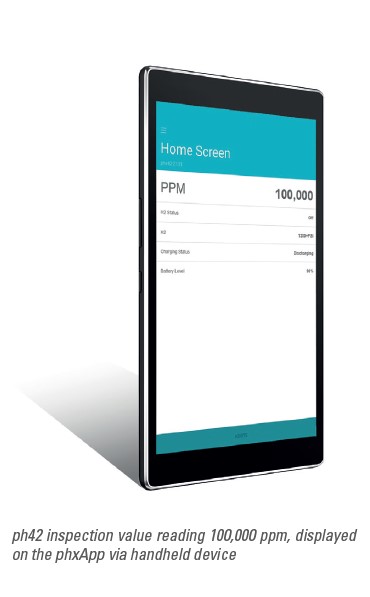
  • Range: 0-100,000+ ppm Methane
  • When calibrated to Zero and 25,000ppm Methane, 15% accuracy is maintained at 100,000ppm.
  • Annual Factory Calibration is available for 100,000ppm. A factory calibration will not be overwritten by daily calibrations in the lower spans.
  • Higher linear performance due to combustion air scrubber and second pump preventing oxygen displacement in combustion air.

Conclusion

End Users must determine the digital equivalent to “off scale,” “measures,” and the necessary calibration requirements. These decisions will determine what to select for your Analyzer Peg Value.

Due to winter weather in the Houston area, our home office in Dickinson will be closed Wednesday morning (1/22) until 12:00 PM.

Support responses might also be delayed.

Please call 877-788-1110 x 6 before coming to the office to pick up or drop off.

Due to winter weather in the Houston area, our home office in Dickinson will be closed Tuesday 1/21 and may also be closed Wednesday 1/22.

Support responses might also be delayed.

Please call 877-788-1110 x 6 before coming to the office to pick up or drop off.

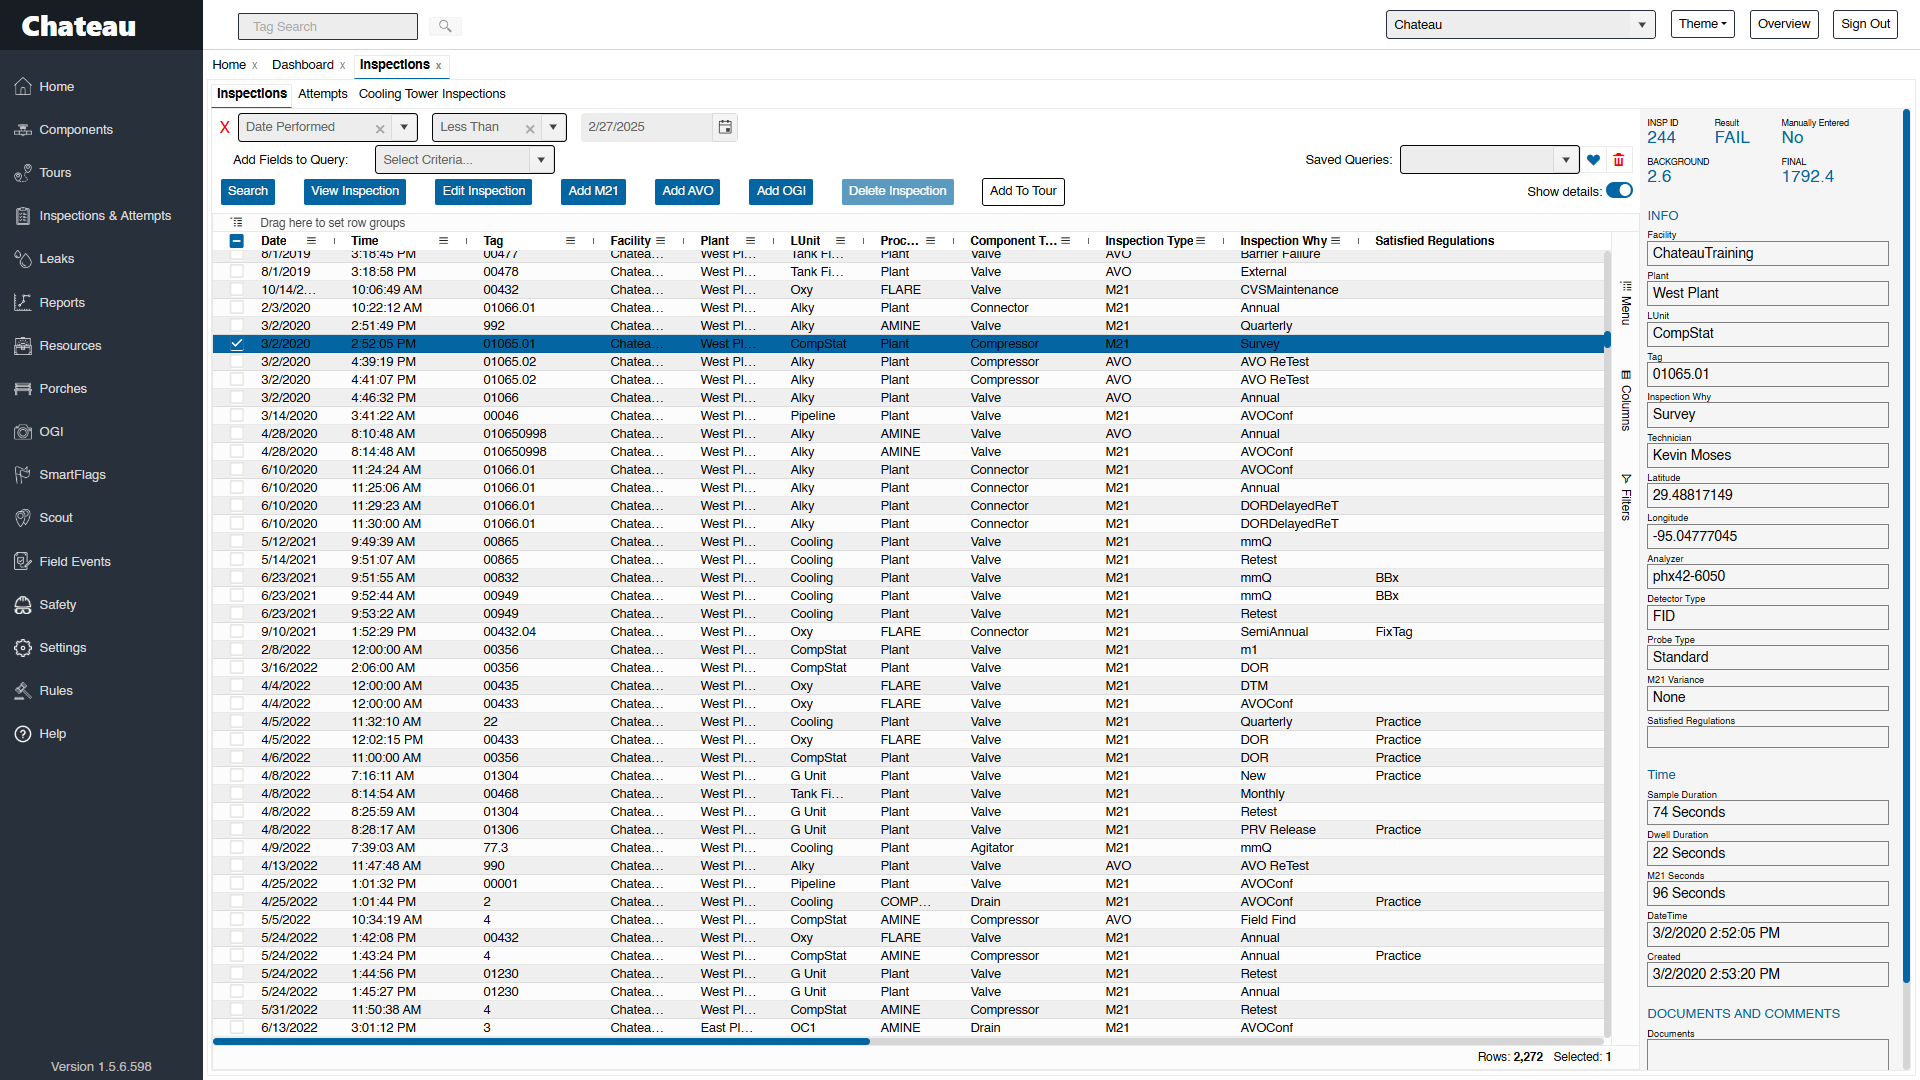
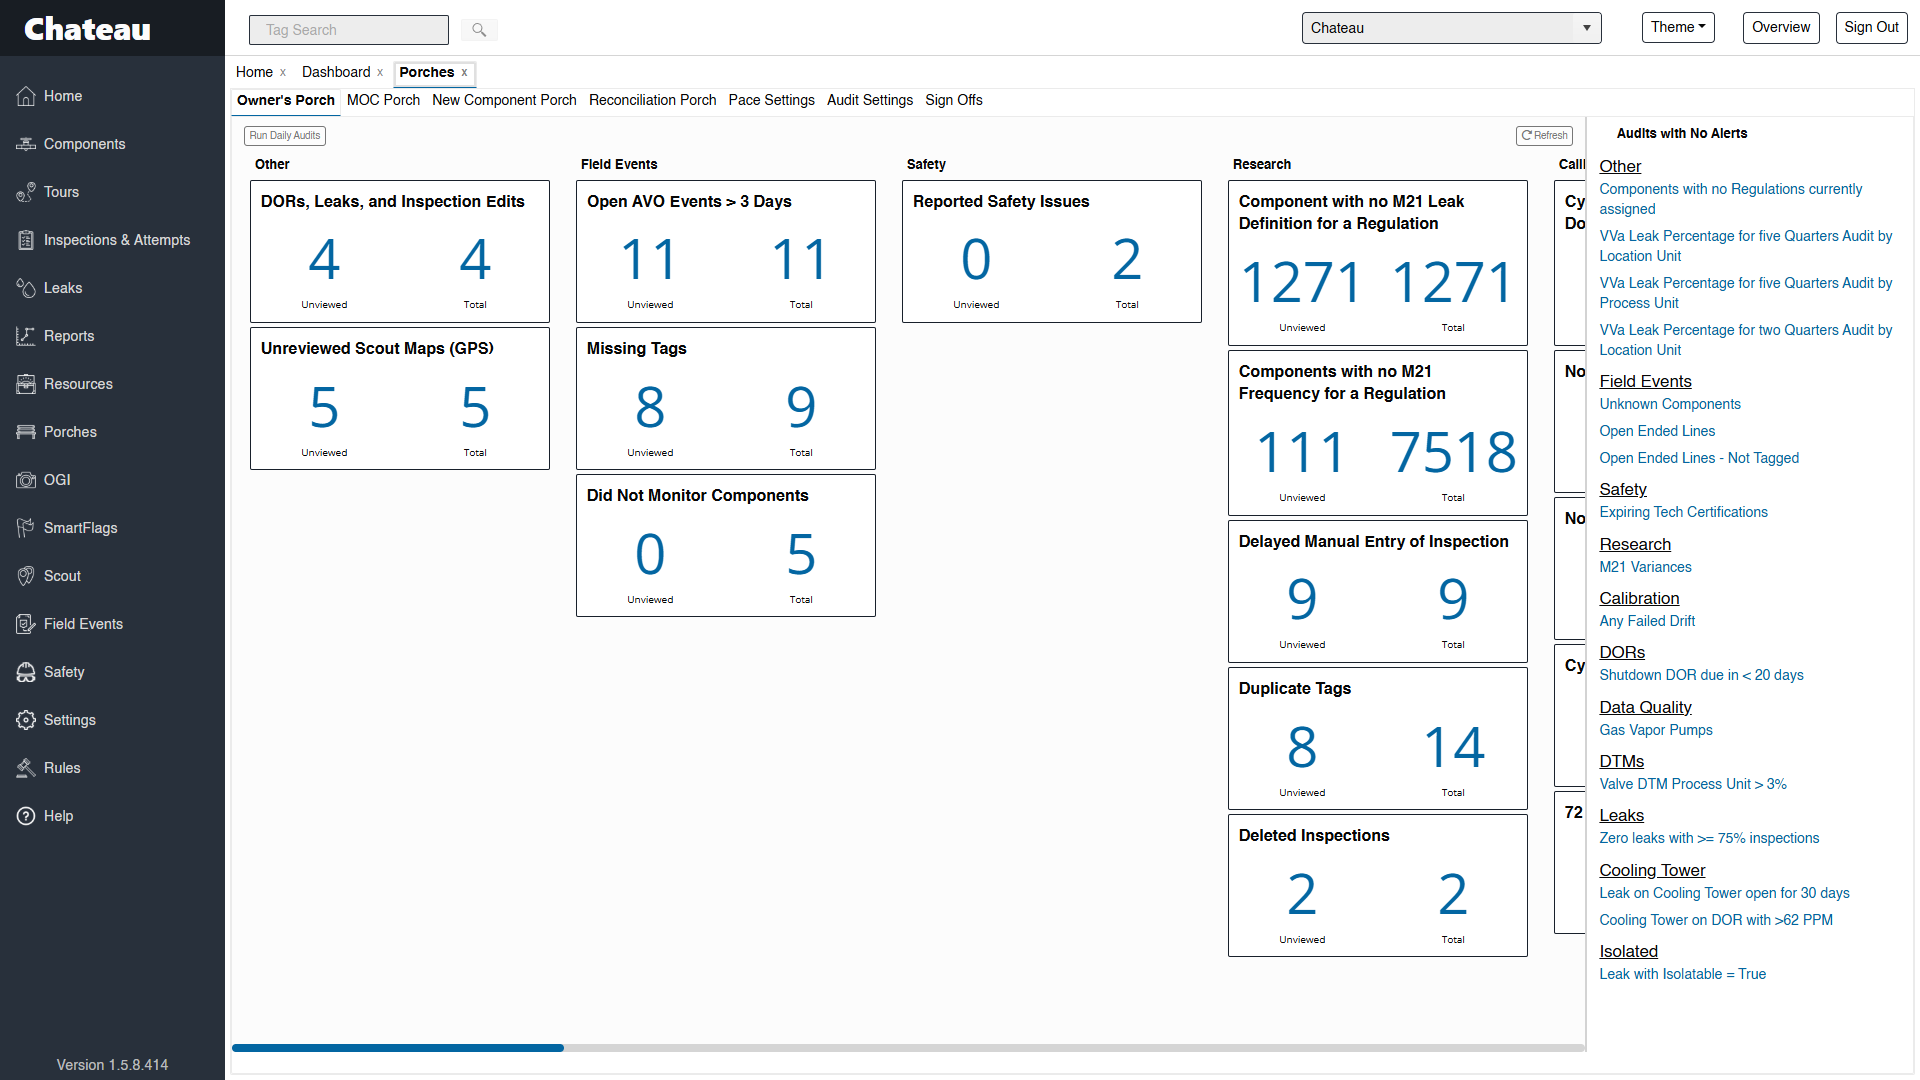
Managing inspections can be a daunting task, especially when juggling multiple inspection types such as M21, OGI, AVO, and Cooling Tower checks. Each inspection requires unique tools, methodologies, and documentation, making it challenging to stay organized while ensuring compliance. Fortunately, with Chateau, scheduling and managing these inspections in a cloud-based database has never been easier or more efficient.


Why Choose Chateau for Your Inspections?

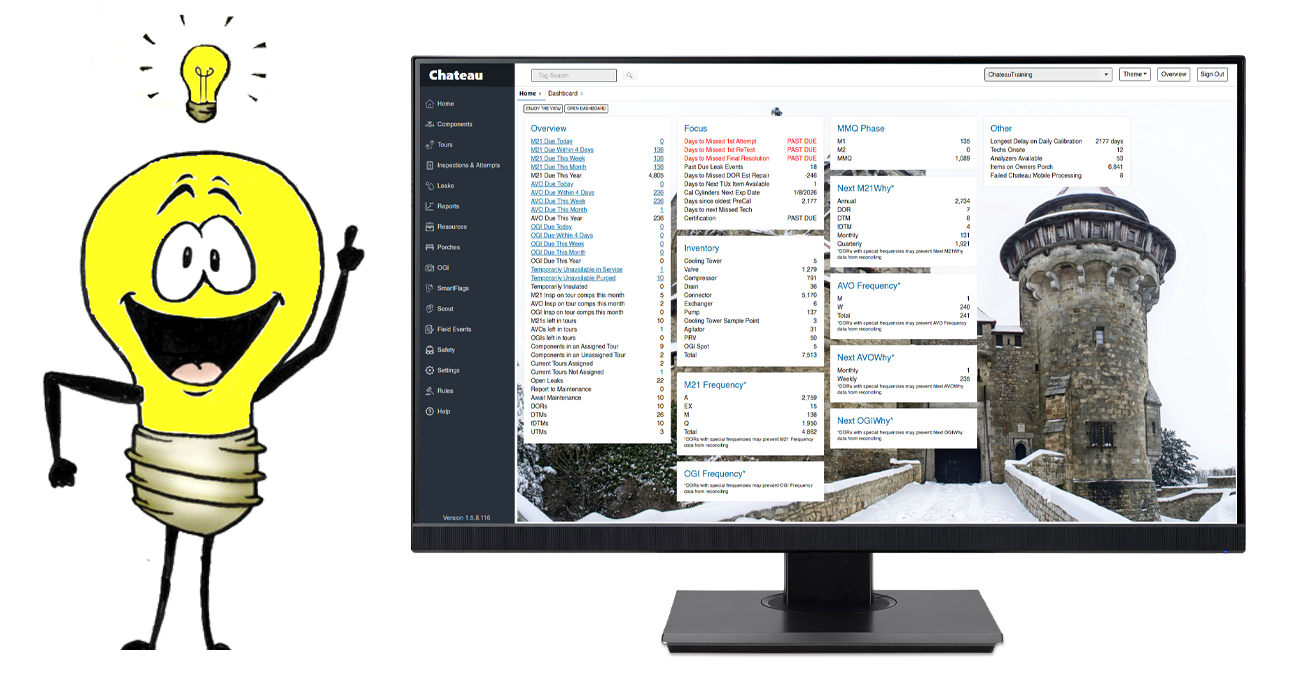
Chateau isn’t just a database; it’s a powerful cloud-based database specifically designed to simplify inspection management. Trusted by industry professionals, it offers unmatched reliability, precision, and adaptability. Whether you’re overseeing environmental compliance, safety protocols, or operational standards, Chateau provides an all-in-one platform that ensures every inspection type is executed seamlessly.


Key Benefits:

  • Centralized Management: Access all inspection data from one secure location, eliminating the need for multiple platforms.
  • Improved Efficiency: Automate scheduling and reduce the risk of missed inspections.
  • Regulatory Compliance: Stay ahead of industry regulations with streamlined documentation and reporting features.
  • Scalability: Ideal for businesses of all sizes, from small teams to enterprise-level operations.

Scheduling M21 Inspections

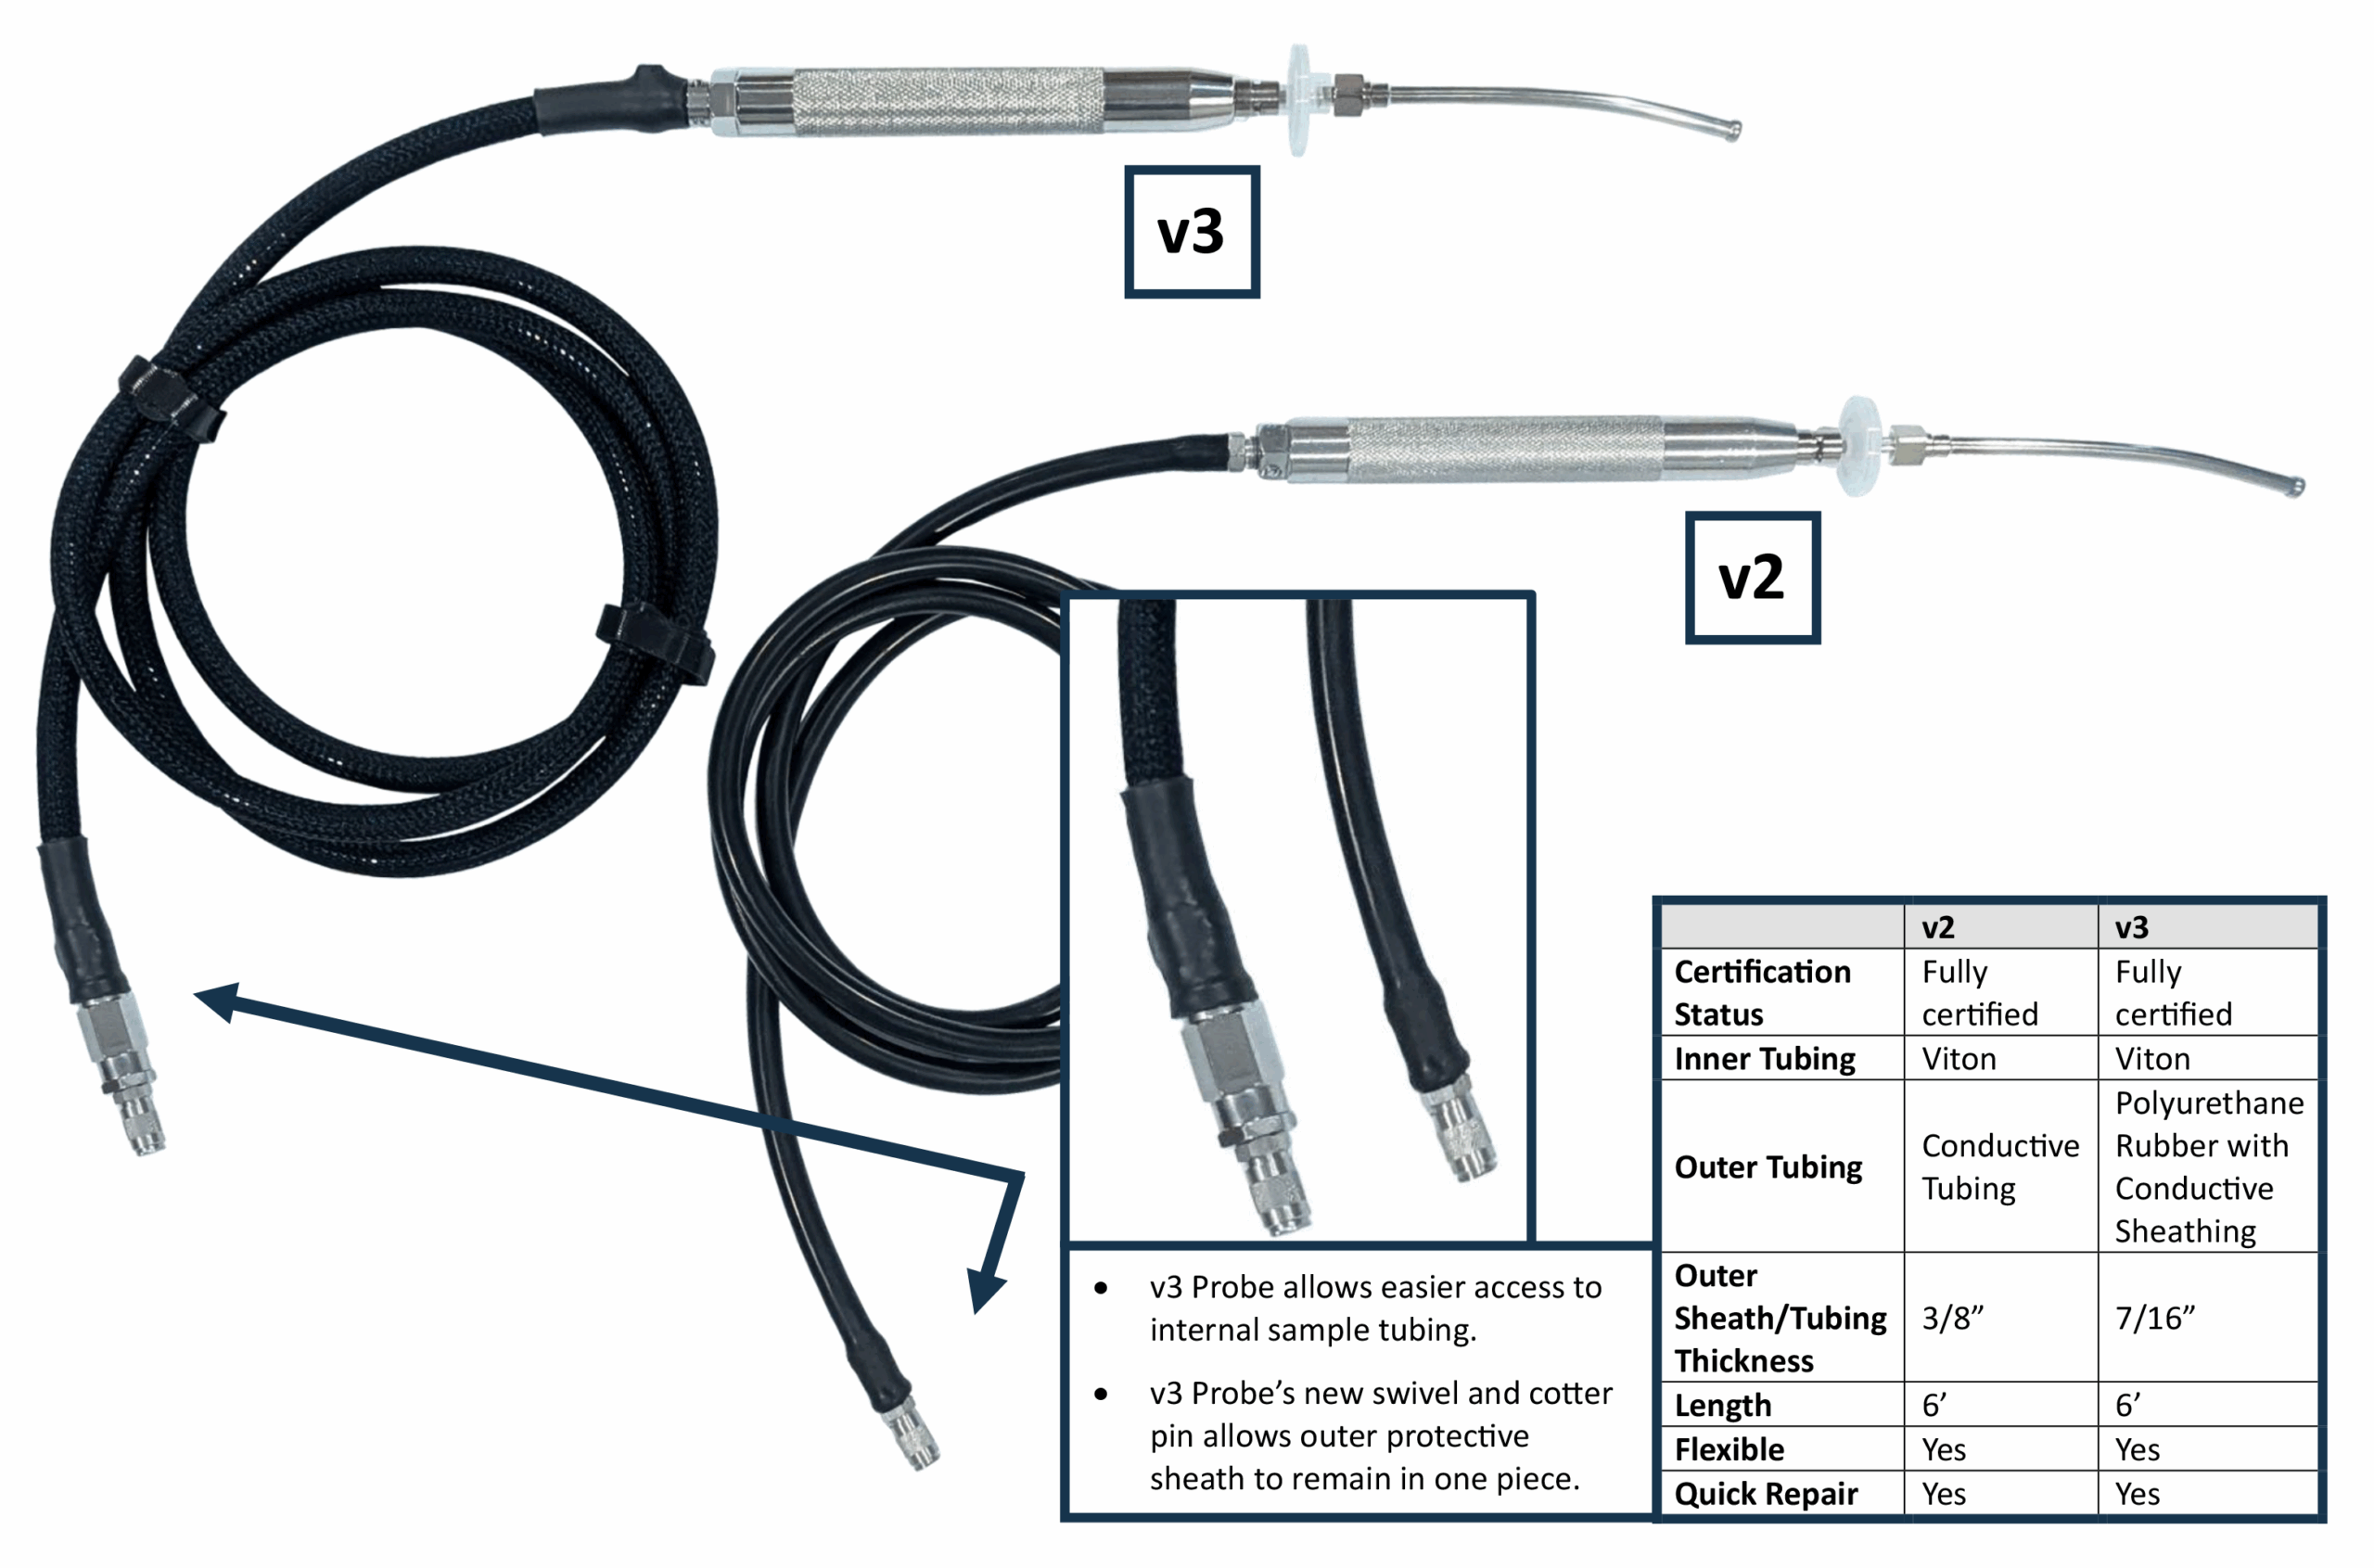
M21 inspections, performed under EPA regulations, involve using a flame ionization detector (FID)—commonly known as a Toxic Vapor Analyzer or TVA—or other approved instruments to measure emissions from equipment components. With a cloud-based database platform such as Chateau, scheduling and tracking M21 inspections becomes straightforward.

  • Custom Scheduling: Set recurring M21 inspections and assign specific technicians.
  • Data Integration: Automatically log emission readings into your Chateau database for easy analysis and reporting.
  • Prevent Overlaps: Ensure inspections are coordinated without conflicting with other operational activities.

Chateau’s intuitive interface ensures each M21 inspection is completed on time while maintaining precise record-keeping for regulatory submissions.


Managing OGI Inspections

OGI (Optical Gas Imaging) inspections require advanced infrared technology to detect gas leaks. These inspections are critical for environmental safety and compliance under regulatory frameworks like NSPS OOOOa.

  • Dynamic Workflows: Tailor workflows to align with your OGI inspection requirements.
  • Archiving Footage: Store captured OGI footage securely and link it to corresponding inspection records within Chateau.

With Chateau’s robust capabilities, OGI inspections are conducted efficiently while ensuring that all findings are meticulously documented.


Simplify AVO Inspections

Audio, Visual, and Olfactory (AVO) inspections are often the first line of defense in identifying leaks or equipment malfunctions. Unlike instrument-based inspections, AVO relies on a technician’s senses to detect irregularities.

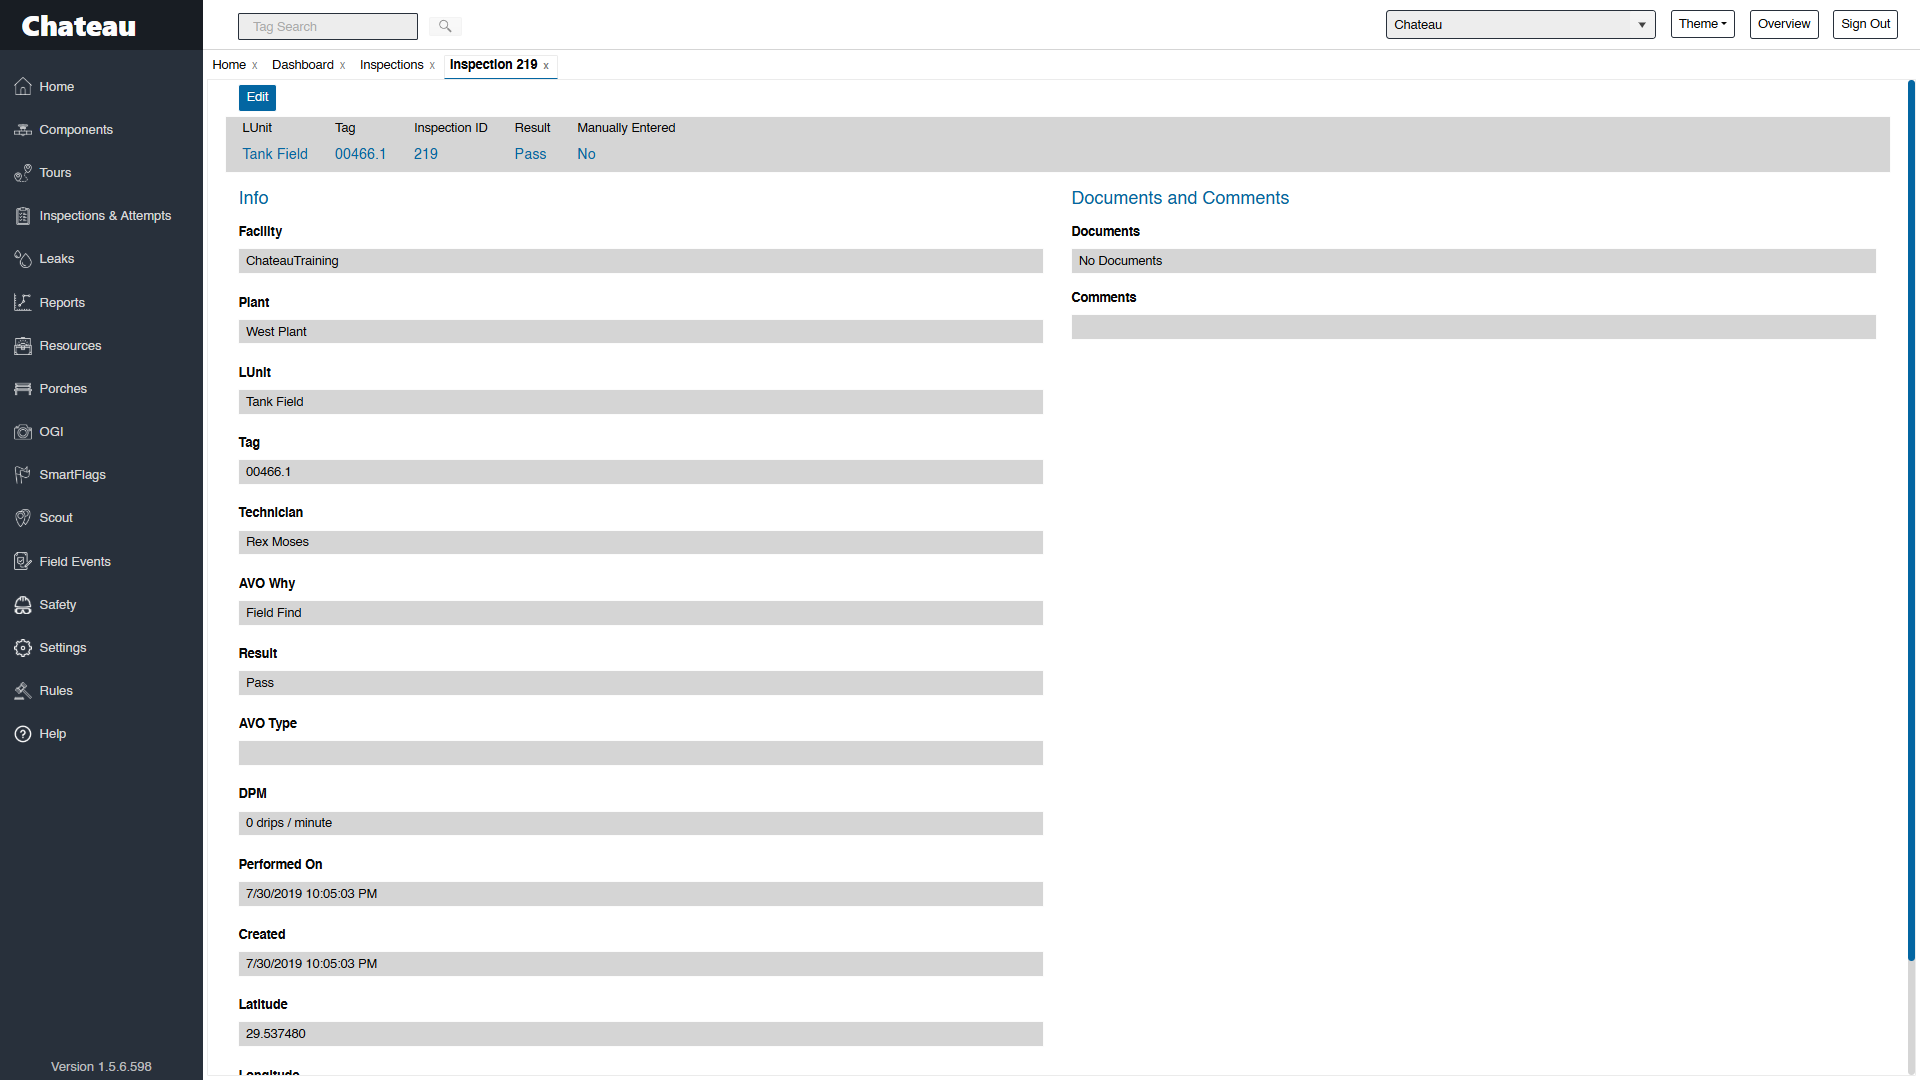
  • Flexible Scheduling: Set weekly, monthly or annual AVO inspections at the component level.
  • Instant Documentation: Record observations directly into Chateau using a handheld.
  • Team Coordination: Assign inspections to technicians.

By bringing AVO inspections into a cloud-based database platform like Chateau, businesses gain a streamlined way to combine their sensory-based findings with other data-driven inspections.


Optimize Cooling Tower Inspections

Cooling Tower inspections play a vital role in maintaining energy efficiency. With Chateau, tracking these often-complex inspections becomes hassle-free.

  • Comprehensive Checklists: Create and manage detailed inspection checklists tailored to cooling tower systems.
  • Automated Alerts: Receive notifications when inspections are due or elements require prompt attention.
  • Historical Insights: Access historical data to monitor trends and plan maintenance schedules proactively.

Chateau allows teams to safeguard cooling tower performance while ensuring regulatory compliance standards are met.


Why a Cloud-based Solution Benefits Your Inspections

Unlike traditional, on-premise systems, a cloud-based database platform like Chateau offers unparalleled advantages for inspection management.

  • Accessibility: Inspectors and managers can access data from anywhere, ensuring seamless collaboration regardless of location.
  • Enhanced Security: Chateau ensures your data is protected with industry-leading cloud security protocols.
  • Scalability: As your inspection needs grow, Chateau adapts to support a larger database and more complex workflows.


Streamline Compliance and Inspections with Chateau

From regulatory obligations to operational efficiencies, inspections are a critical aspect of any industrial operation. With Chateau, you can ensure every M21, OGI, AVO, and Cooling Tower inspection is scheduled, managed, and documented to perfection in a cloud-based database.

Don’t leave your inspection processes to chance. Empower your team with a solution trusted by industry professionals worldwide. Experience how Chateau can revolutionize your inspection management system.

Effective January 1, 2025, we will no longer repair phx21s, or make them available for rent. If you have a phx21 requiring repairs, please request an RMA by 12/31/24, and we will repair it if the required parts are available.

For now, we will continue to support phx21 troubleshooting through hardware issues, and supply the following parts for level 1 repairs while supplies last:

LPN Part Name
766 Glow Plug
1016 Probe Quick Connect
1157 Thermocouple
1163 Pump Assembly
1541 Batt. Connection Harness

Since the phx21 made its debut in 2008, LDARtools has worked to produce high-quality products and services for our customers. With 1,219 phx21s and 17 Brownie Celebrations (no machines in for repair) later, we say a fond farewell as the era of the phx21 draws to a close.

We look forward to our continued support of your LDAR programs with the phx42 and Chateau.

Please contact sales@ldartools.com if you need assistance with a quote.

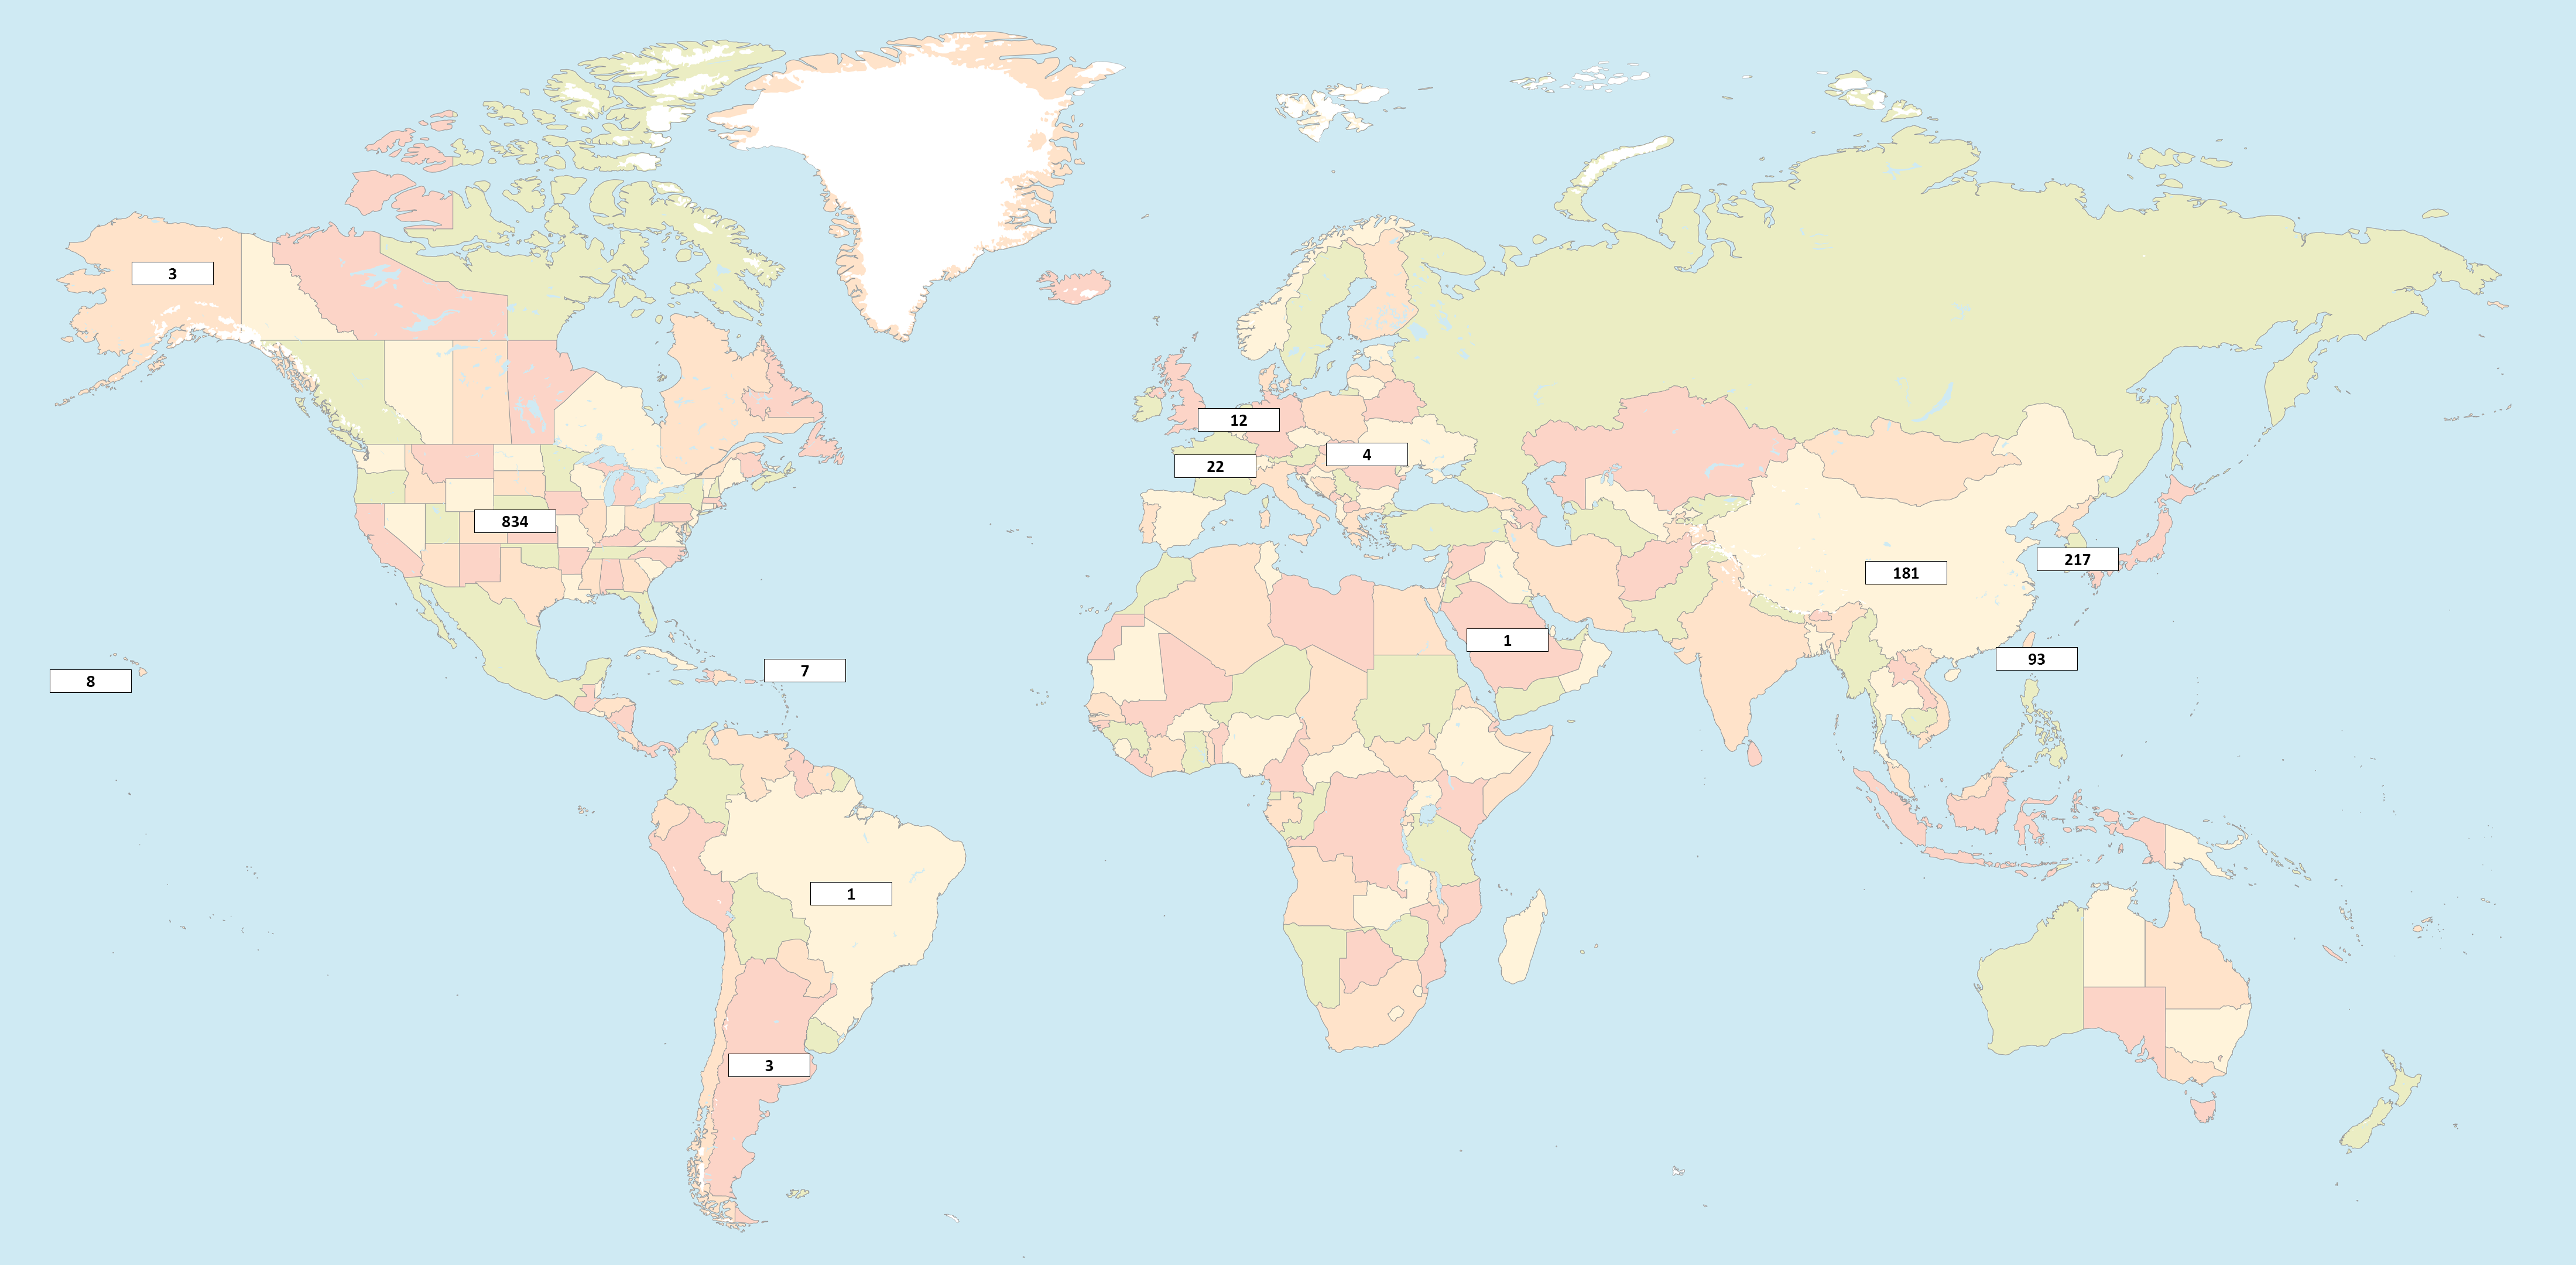
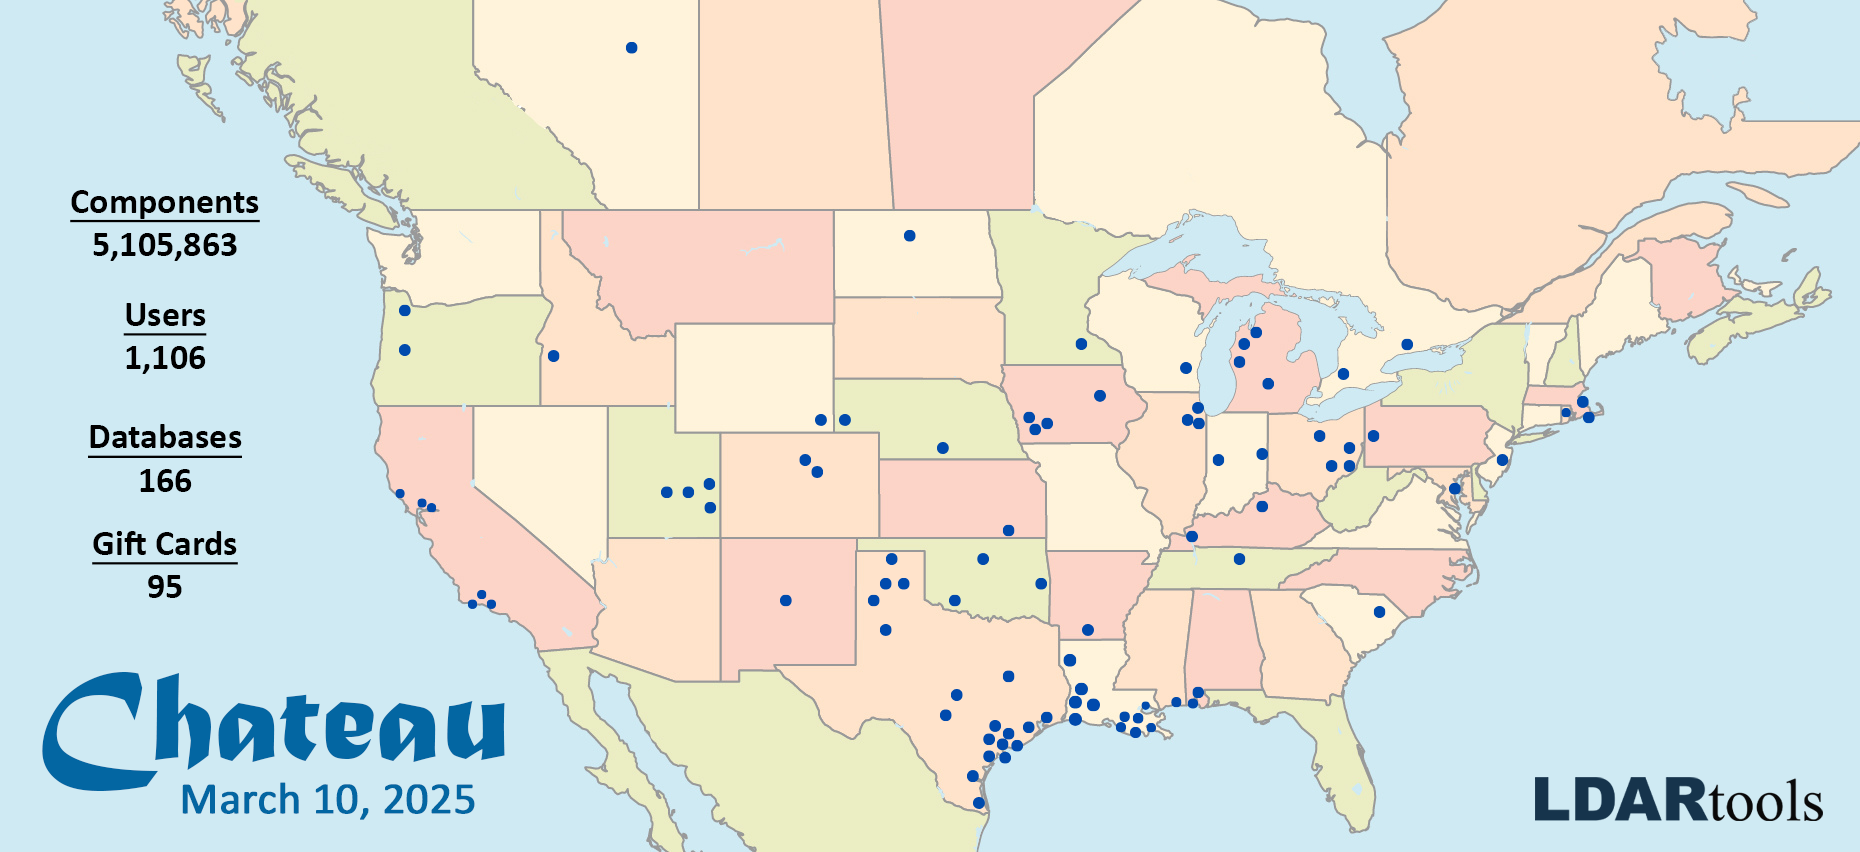
The achievement of 1,000 users is not just a number; it’s a reflection of the trust and satisfaction of our community.

Our users come from various industries, each utilizing Chateau to streamline processes, boost productivity, and achieve their goals. It is this diversity and the success stories of our users that drive us to keep pushing boundaries and setting new standards.

Chateau’s growth is not merely about numbers; it’s about the stories and the successes of our users. With a focus on delivering the best possible service, our platform has evolved significantly over time. Each update and feature has been carefully crafted to enhance user experience, ensuring that Chateau remains at the forefront of the industry. We’ve listened to user feedback and made continuous improvements, resulting in a platform that is both user-friendly and highly functional.

Click here to receive celebration stickers!

You can also email sales@ldartools.com with the following information:

  1. City, State  ZIP
  2. Street Address Line 1
  3. Street Address Line 2
  4. Complete shipping address (cannot be a PO Box)
  5. Email address
  6. First and Last Name
  7. Site ID or Company Name
  8. Number of stickers requested at your site

Thank you for being part of the Chateau community. Here’s to your continued success—and to reaching new milestones together!

Exciting News from LDARtools!


We are thrilled to announce our new monthly webinar series, Chateau Connect, dedicated to all things Chateau! Through Chateau Connect, we will provide all of you with a quick-dive into various Chateau topics each month. The purpose of this webinar, of course, is to not only improve your experience using Chateau, but to also show Chateau’s full capabilities in the world of LDAR database software. With this being our first webinar in the series, we would love to have you join us!


If you are a current Chateau user, you should have received a registration link in your inbox. If you do not see the email, please reach out to sales@ldartools.com. We look forward to seeing you there!


And if you are not a Chateau user but are curious as to what our new monthly webinar series will entail, you can get a sneak peek by booking a no pressure meeting with our Client Success Specialist.

Leak Detection and Repair (LDAR) programs are essential for managing and mitigating fugitive emissions in industrial environments. Furthermore, by leveraging advanced technologies, such as the phx42 FID analyzer, SpanBox5 calibration system, and Chateau database software, you can streamline the detection, quantification, and reporting of leaks to ensure safety and environmental compliance.

Here’s a step-by-step guide to creating an effective LDAR program using these tools.

Step 1: Set Up the phx42 FID Analyzer

The phx42 Flame Ionization Detector (FID) analyzer, also commonly known as Toxic Vapor Analyzer or TVA*, is at the heart of your LDAR program, designed for accurate detection of hydrocarbons to aid with environmental compliance. Begin by:

  1. Charging the battery.
  2. Powering on the phx42.
  3. Filling with Hydrogen.

The phx42 FID analyzer is an innovative tool to ensure a robust LDAR program for the purpose of ensuring environmental compliance.


*This is a misnomer, but also a term the industry has accepted to describe portable FIDs.


Step 2: Integrate SpanBox5 for Calibration Management

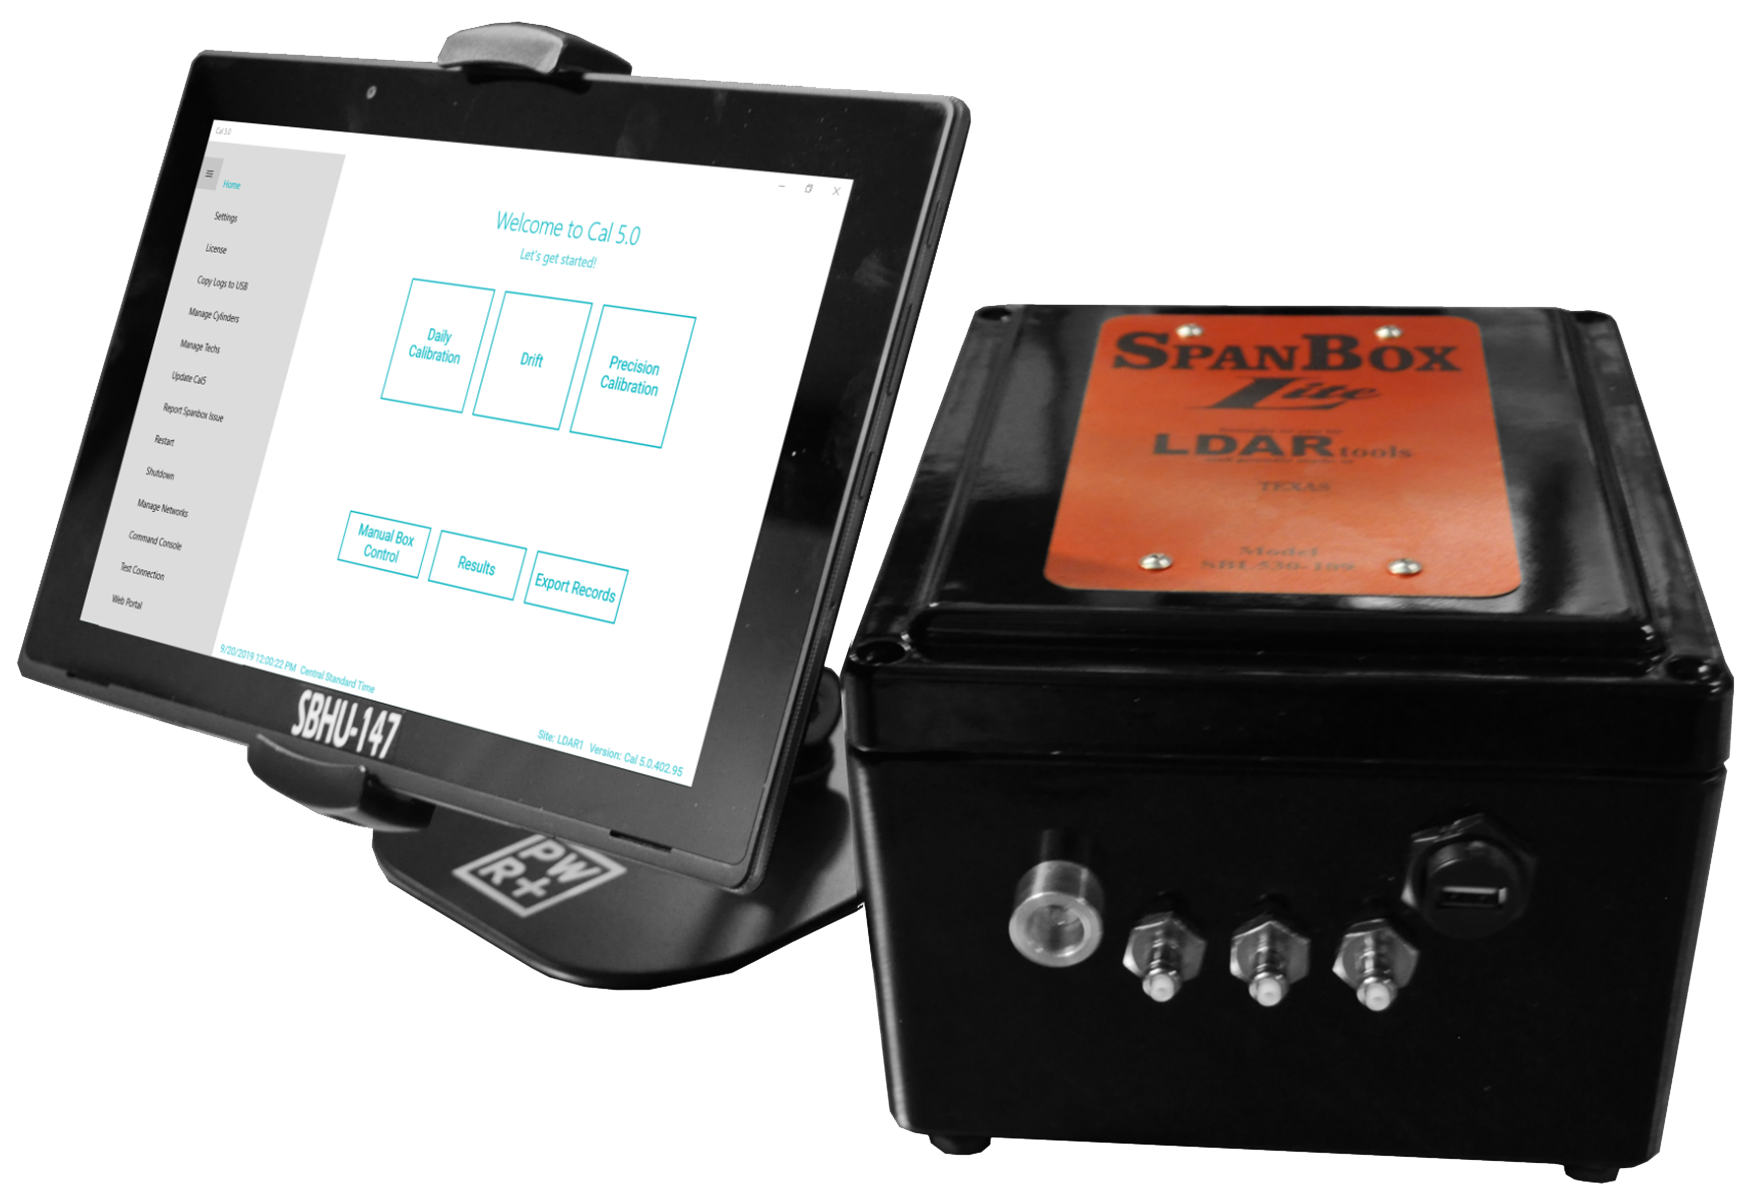
A quality analyzer is not enough, however. Additionally, you will need an efficient calibration system for your analyzers. The SpanBox5 FID calibration system is an innovative tool for automating the calibration and verification process of the phx42. To integrate the SpanBox5:

  1. Connect the phx42 to your gas bottles using the appropriate regulators.
  2. Perform calibrations.
  3. Sync the calibration data to maintain an accurate record of calibration history, which is crucial for compliance and auditing.

SpanBox5 Ionization Detector Calibration System

Step 3: Use Chateau Software for Comprehensive Data Management

Lastly, you will need a central to house all of this information. LDARtools’ Chateau LDAR database software serves as this hub for managing all the data collected from your LDAR program, and is the final step in meeting the highest standards of environmental management. Here is how to use it:

  1. Import data from the phx42.
  2. Utilize Chateau’s reporting tools to generate detailed reports on leak detection, calibration status, and compliance. Customize reports to meet regulatory requirements and internal standards.
  3. Maintain a detailed record of all detected leaks, repairs, and calibration checks. This ensures your LDAR program remains compliant with industry regulations.

Chateau LDAR database software

Conclusion

Creating an LDAR program with the phx42 FID analyzer, SpanBox5 calibration system, and Chateau database software offers a robust, integrated approach to managing fugitive emissions to ensure environmental compliance. By following these steps, you can ensure your program is efficient, compliant, and capable of detecting leaks accurately and responding promptly.

Price increases are not surprising. In spite of rising prices for virtually everything we need, we have continued to invest in making our products the most innovative and valuable tools for the LDAR industry.
Effective August 13, 2024, all new Chateau quotes will include a Chateau Set-up/Import Fee to cover the cost of basic imports. All existing quotes will be honored with POs received before September 1, 2024, or the quote expiration date.


If you have any questions, please feel free to contact sales@ldartools.com.


Through it all, we appreciate your business.

Negative Flameout Values

A recent firmware update addressed the representation of negative values in the phx42 FID analyzer, also commonly known as a Toxic Vapor Analyzer or TVA*. Negative values always indicate a flame-out condition, where the FID is not detecting any VOCs due to a lack of ignition. The firmware update ensures these negative values are represented in a specific manner, avoiding confusion and ensuring accurate readings. The specific negative value displayed indicates the reason the phx42 is not ignited.

*This is a misnomer, but also a term the industry has accepted to describe portable FIDs.

Reading Error Message
-40 “Pump at max power for too long, report the issue.”
-41 “Probe Flow is blocked. Check Probe/ Change Filter.”
-42 “Feels like you just removed my filter. Please give me a fresh filter so we can get back to work.”
-45 “Looks like we just found a high PPM leak. Wait 30 seconds and reignite me. (Chamber overtemp)”
-46 “Trying to ignite! If 3rd attempt fails, report the issue.”
  • Note: Most monitoring applications show this text as a popup.


Contamination During Calibration

When any analyzer is calibrated, any contamination from previous days leaks that burns off during the day can cause the readings to shift slightly. This is a linear shift across the scale. That is to say, 1 ppm (parts per million) of contamination is burned off, it will reduce ambient by 1 ppm as well as 10,000 ppm.

Previously, if the phx21 detected a value below the zero-calibrated level, it would enter a pattern of alternating 0.0 and 0.1 readings. This pattern was implemented to avoid displaying a negative value, which is not possible in practical scenarios as readings cannot be less than 0 ppm. This would result in lower readings throughout the calibration scale. All portable FIDs at the time could experience this drift, resulting in lower readings throughout the day as well as during drifts.


Calibration Adjustments to the phx42

When the phx42 is calibrated under contaminated conditions and then later burned off, causing the ppm level to drop below 0 for more than 1 minute, the calibration table is edited in real-time. This adjustment is crucial for maintaining accuracy, as it corrects all the calibration points for any leftover VOCs which may have affected the calibration process and are no longer impacting the machine.

Conditions must be met for this adjustment to take place. The firmware monitors multiple conditions to ensure the machine is ignited and running properly. If a flame out/reignition occurs, the calibration table will revert to the original version to prevent an outside factor, like a probe or filter change, from impacting this feature (the phx42 will shut down during filter or probe changes). If, after reignition, the ppm returns to negative for the required time, adjustments will be made again as appropriate.


Practical Implications

In the older portable FID models—including phx21, TVA1000, and TVA2020—negative drift would cause interruptions, requiring work stoppage, recalibration, drift failures, and rework. The phx42, with its improved firmware, eliminates these issues by ensuring readings never fall into negative territory and that accuracy is maintained.


Conclusion

The phx42 portable FID by LDARtools is an advanced instrument for VOC detection, with sophisticated firmware to handle calibration and negative values efficiently. By continuously improving its firmware, LDARtools ensures the phx42 remains a reliable and accurate tool for environmental monitoring, minimizing the need for manual interventions and providing consistent accuracy.